概述 之前学习普罗米修斯的时候还是个初学者,现在工作了几年,因为接触了很多其他领域的知识,对Prometheus有更深的理解了,
所以我就以现在的角度重新整理一遍Prometheus相关的知识点
exporter官网:Exporters and integrations | Prometheus
特点 数据特点
数据 = 指标(metric)+标签(labels)+时间序列(time series)
指标:要监控的具体项,比如CPU用户态使用率、CPU等待时间、可用内存等 标签:要为指标附加的维度信息,用来区分不同业务、环境等,同k8s的labels 时间序列:指标随时间变化的数值序列
1
2
3
比如监控某个服务的http请求延迟: metric: http_request_duration_ labels: service="app-service" ,endpoint="/login" ,method="post" ,instance="10.0.0.1"
数据采集方式
pull模式 监控系统主动去被监控目标(exporter)拉取指标数据,主动控制采集频率 比如,node_exporter在服务器上运行,暴露/metrics,Prometheus定期请求访问拉取数据
PushGateway模式 需要额外组件,主动向PushGateway推送指标数据,监控系统再从Push通过shell、python脚本获取的自定义数据,适用于短期/批处理作业 ( 这种方式严格来说不算“被动模式”,因为Pushgateway只是一个中间组件,最终还是由Prometheus向它主动拉取)
查询语言PromQL
支持实时数据查询、聚合统计、复杂计算
表达灵活,支持过滤、分组、运算
可以用于制作仪表盘和告警规则
动态监控与自动发现
自动发现、删除监控对象,无需人工配置维护,适应云原生和动态环境
灵活告警机制
可以基于PromQL表达式设置告警条件,支持阈值触发和持续时间判断
可集成altermanager,管理告警去重、分组、抑止,并支持多种渠道
工作流程 1.数据采集 通过Pull方式直接拉取监控指标,包括使用了 Client Library 的应用,exporter,和使用Pushgateway的临时指标
2.数据存储 监控数据以时间序列的形式存储在自带的时间序列数据库中(TSDB),这是一种专门为处理时间序列数据而优化的数据库。
3.规则评估 根据预先配置的告警规则,周期性对时间序列数据进行计算评估,满足条件则会生成对应告警事件
4.告警处理 告警事件会发送给alter manager,对告警进行去重分组,根据配置的路由策略,将告警以多种形式推送给运维人员
5.查询分析与可视化
使用PromQL对历史和实时数据进行灵活查询,聚合和分析,并且可以使用自带Web或接入Grafana,使用Prometheus作为数据源构建各样图表
数据类型 Counter计数器
Counter单调递增,只增加不减少,适用于统计事件发生次数,重启会被重置为0
适用:请求总数、错误总数、处理字节数 rate(http_requests_total[5m]) 过去5分钟每秒平均的http
Gauge测量器
Gauge指标可以任意增减,适合表示当前状态的数值,能反应瞬时的资源使用量或状态数值 使用:内存使用量、磁盘剩余空间、当前并发连接数
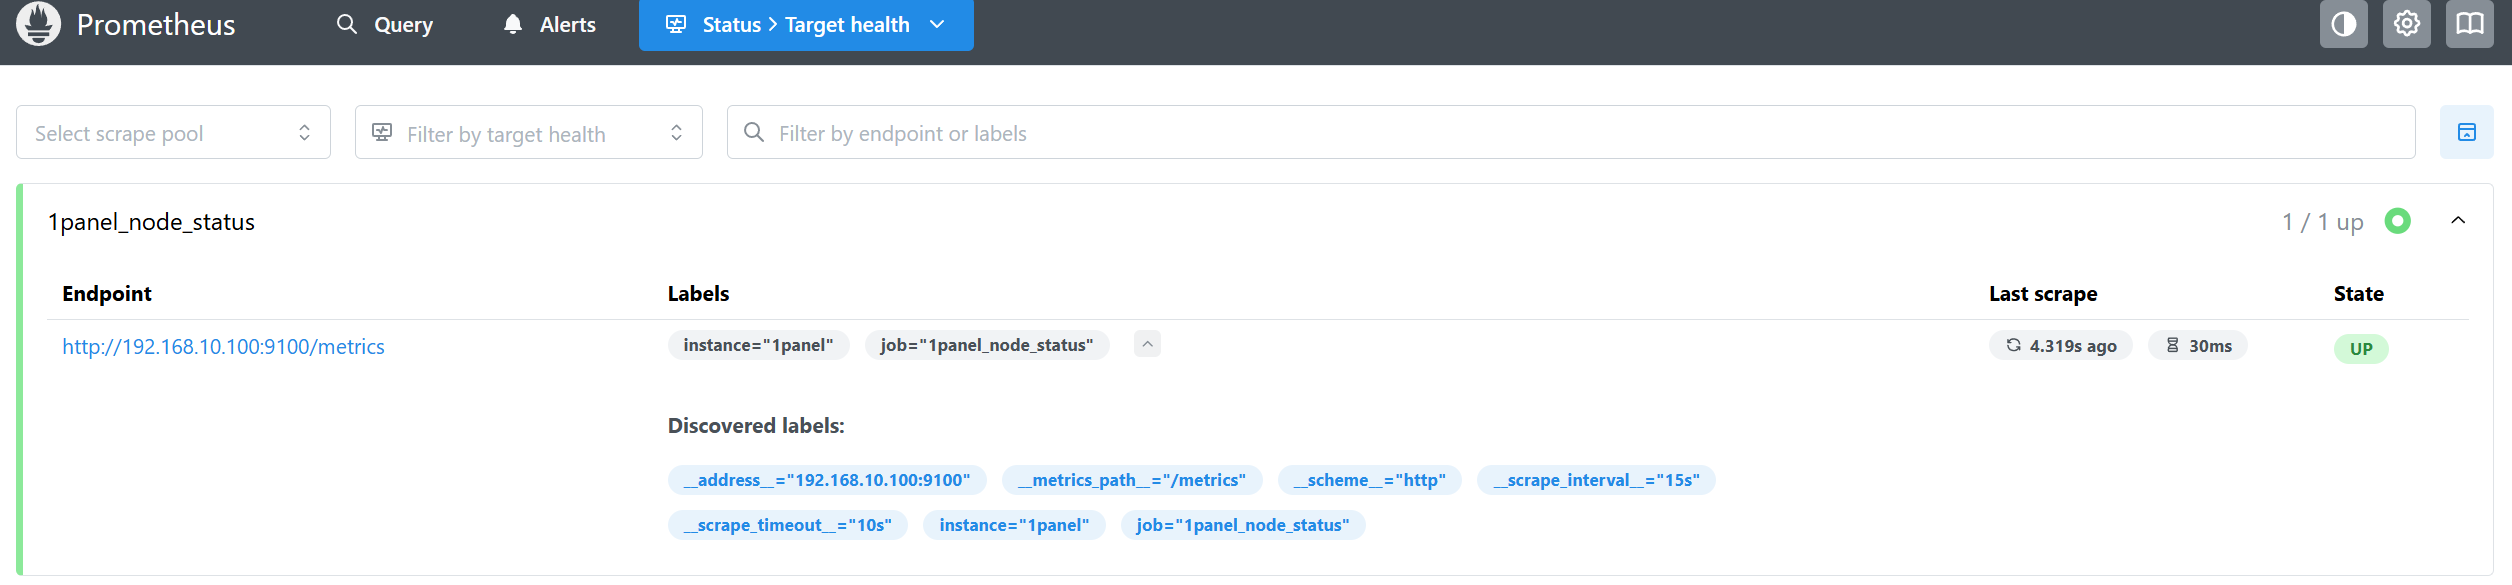
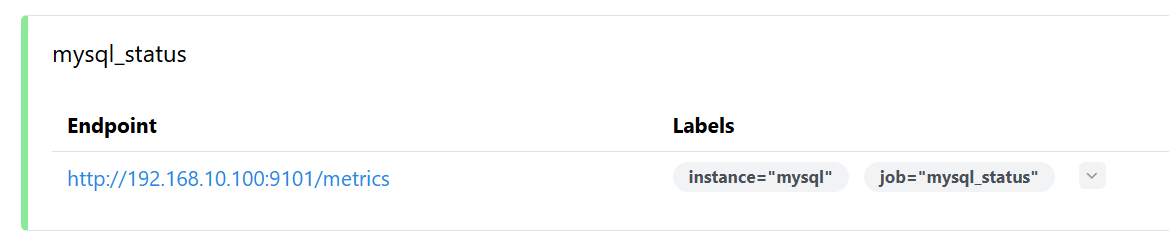
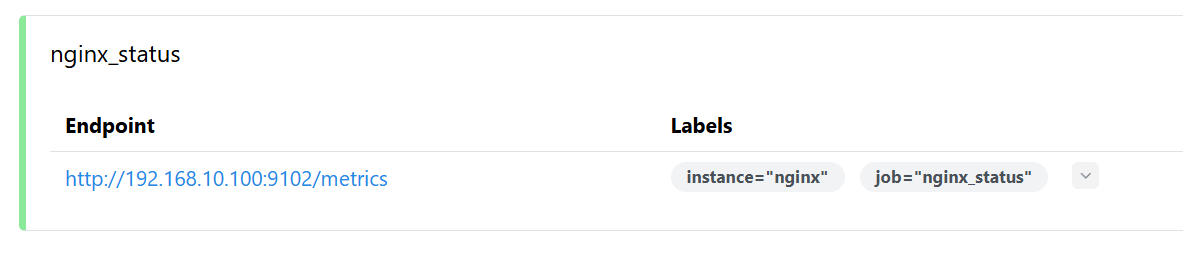
安装与配置 1 2 3 4 5 6 7 8 9 10 11 12 13 14 15 16 17 18 19 20 21 22 23 24 25 26 27 28 29 30 31 32 33 34 35 36 37 38 39 40 41 42 43 44 45 46 47 48 49 50 51 52 53 54 55 56 57 58 59 60 61 62 63 64 65 66 hostnamectl set-hostname prometheus && bash yum -y install bash-completion wget tar && bash systemctl disable firewalld.service --now setenforce 0 sed -i 's/^SELINUX=.*/SELINUX=disabled/g' /etc/selinux/config wget <https://github.com/prometheus/prometheus/releases/download/v3.5.0/prometheus-3.5.0.linux-amd64.tar.gz> tar -xf prometheus-3.5.0.linux-amd64.tar.gz cp -r prometheus-3.5.0.linux-amd64 /usr/local/cd /usr/local/prometheus-3.5.0.linux-amd64/global: scrape_interval: 15s evaluation_interval: 15s alerting: alertmanagers: - static_configs: - targets: - 192.168.10.100:9093 rule_files: - "/usr/local/prometheus-3.5.0.linux-amd64/rules.yml" scrape_configs: - job_name: "prometheus" static_configs: - targets: ["localhost:9090" ] labels: instance: "prometheus" - job_name: "openwrt_node_status" static_configs: - targets: ["192.168.10.254:9100" ] labels: instance: "openwrt" - job_name: "1panel_node_status" static_configs: - targets: ["192.168.10.100:9100" ] labels: instance: "1panel" - job_name: "mysql_status" static_configs: - targets: ["192.168.10.100:9101" ] labels: instance: "mysql" - job_name: "nginx_status" static_configs: - targets: ["192.168.10.100:9102" ] labels: instance: "nginx"
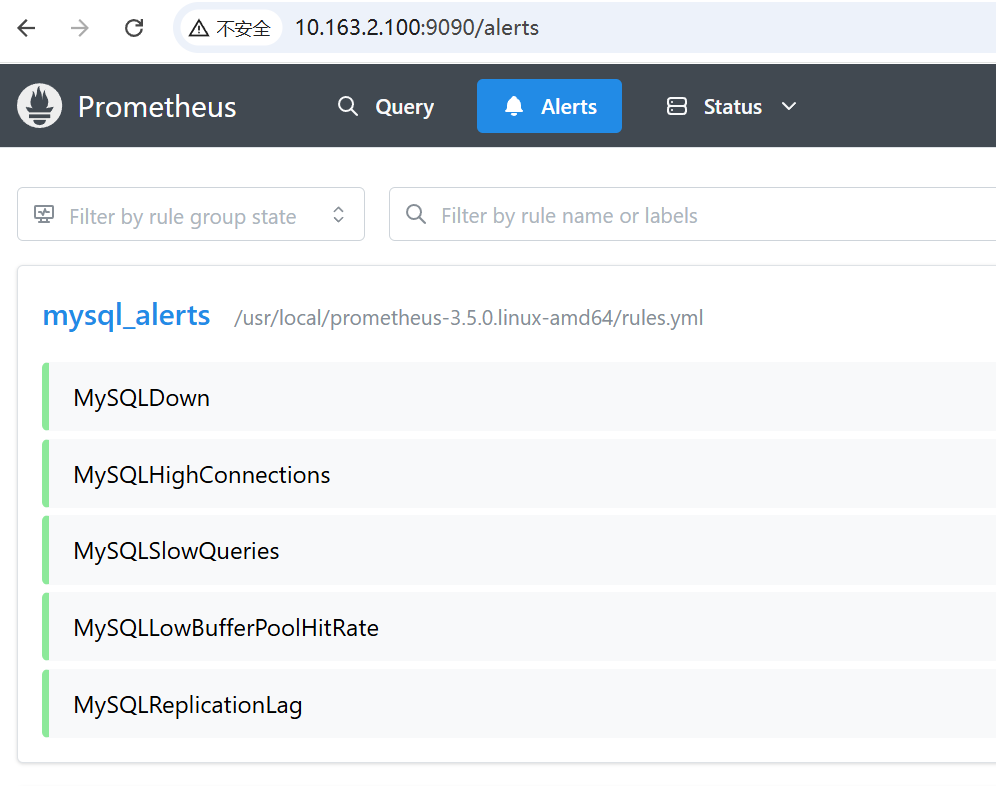
配置告警规则 前面将规则配置文件放在了/usr/local/prometheus-3.5.0.linux-amd64/rules.yml
1 2 3 4 5 6 7 8 9 10 11 12 13 14 15 16 17 18 19 20 21 22 23 24 25 26 27 28 29 30 31 32 33 34 35 36 37 38 39 40 41 42 43 44 45 46 47 48 49 50 51 52 53 54 55 56 57 58 59 60 61 62 63 64 65 66 67 68 69 70 71 72 73 74 75 76 77 78 79 80 81 82 83 84 85 86 87 88 89 90 91 92 93 94 95 96 97 98 99 100 101 102 103 104 105 106 107 108 109 110 111 112 113 114 115 116 117 118 119 120 121 122 123 124 125 126 127 128 129 130 131 132 133 134 135 136 137 138 139 140 141 142 143 144 145 146 147 148 149 150 151 152 153 154 155 156 157 158 159 160 161 162 163 164 165 166 167 168 169 170 171 172 173 174 175 176 177 178 179 180 181 182 183 184 185 186 187 cd /usr/local/prometheus-3.5.0.linux-amd64/vim rules.yml groups : - name: node_alerts rules: - alert: HighCpuUsage expr : (1 - avg(rate(node_cpu_seconds_total{mode="idle" }[5m])) by (instance)) * 100 > 80 for : 5m labels: severity: warning category: resource annotations: summary: "节点CPU使用率过高" description: "{{ $labels .instance }} 的CPU使用率已超过80%持续5分钟,当前值为 {{ $value | printf \\" %.2f\\" }}%" # 2. 内存使用率过高(超过85%持续5分钟) - alert: HighMemoryUsage expr: (1 - (node_memory_MemAvailable_bytes / node_memory_MemTotal_bytes)) * 100 > 85 for: 10s # 这个不好测,我就把它弄小点 labels: severity: warning category: resource annotations: summary: " 节点内存使用率过高" description: " {{ $labels .instance }} 的内存使用率已超过85%持续5分钟,当前值为 {{ $value | printf \\"%.2f\\" }}%" # 3. 磁盘空间使用率过高(超过90%) - alert: HighDiskUsage expr: (node_filesystem_size_bytes{fstype=~" ext4|xfs"} - node_filesystem_free_bytes{fstype=~" ext4|xfs"}) / node_filesystem_size_bytes{fstype=~" ext4|xfs"} * 100 > 90 for: 5m labels: severity: warning category: resource annotations: summary: " 磁盘空间使用率过高" description: " {{ $labels .instance }} 的 {{ $labels .mountpoint }} 分区使用率已超过90%,当前值为 {{ $value | printf \\"%.2f\\" }}%" # 4. 磁盘IO过高(读取+写入延迟超过100ms) - alert: HighDiskIOLatency expr: rate(node_disk_read_time_seconds_total[5m]) + rate(node_disk_write_time_seconds_total[5m]) > 0.1 for: 5m labels: severity: warning category: performance annotations: summary: " 磁盘IO延迟过高" description: " {{ $labels .instance }} 的磁盘 {{ $labels .device }} IO延迟超过100ms,当前值为 {{ $value | printf \\"%.4f\\" }}s" # 5. 网络入栈流量过大(超过100MB/s持续1分钟) - alert: HighNetworkInboundTraffic expr: rate(node_network_receive_bytes_total[1m]) > 100 * 1024 * 1024 for: 1m labels: severity: warning category: network annotations: summary: " 网络入栈流量过大" description: " {{ $labels .instance }} 的 {{ $labels .device }} 网卡入栈流量超过100MB/s,当前值为 {{ $value | printf \\"%.2f\\" }} bytes/s" # 6. 节点宕机(up指标为0) - alert: NodeDown expr: up{job=~" .*node_status.*"} == 0 for: 1m labels: severity: critical category: availability annotations: summary: " 监控节点宕机" description: " {{ $labels .instance }} 节点已宕机超过1分钟" # MySQL监控告警规则组 - name: mysql_alerts rules: # 1. MySQL服务不可用 - alert: MySQLDown expr: mysql_up == 0 for: 1m labels: severity: critical category: availability annotations: summary: " MySQL服务不可用" description: " MySQL实例 {{ $labels .instance }} 已宕机超过1分钟" # 2. 连接数超过最大限制的80% - alert: MySQLHighConnections expr: mysql_global_status_threads_connected / mysql_global_variables_max_connections * 100 > 80 for: 5m labels: severity: warning category: performance annotations: summary: " MySQL连接数过高" description: " MySQL实例 {{ $labels .instance }} 的连接数已达到最大连接数的{{ $value | printf \\"%.2f\\" }}%" # 3. 查询响应时间过慢(平均查询时间超过1秒) - alert: MySQLSlowQueries expr: rate(mysql_global_status_slow_queries[5m]) > 10 for: 5m labels: severity: warning category: performance annotations: summary: " MySQL慢查询过多" description: " MySQL实例 {{ $labels .instance }} 在过去5分钟内慢查询数量为 {{ $value | printf \\"%.2f\\" }} 个/秒" # 4. InnoDB缓冲池命中率过低(低于95%) - alert: MySQLLowBufferPoolHitRate expr: (1 - (mysql_innodb_buffer_pool_reads / (mysql_innodb_buffer_pool_read_requests + mysql_innodb_buffer_pool_reads))) * 100 < 95 for: 5m labels: severity: warning category: performance annotations: summary: " MySQL缓冲池命中率过低" description: " MySQL实例 {{ $labels .instance }} 的InnoDB缓冲池命中率低于95%,当前值为 {{ $value | printf \\"%.2f\\" }}%" # 5. 复制延迟(如果有主从复制) - alert: MySQLReplicationLag expr: mysql_slave_status_seconds_behind_master > 30 for: 5m labels: severity: warning category: replication annotations: summary: " MySQL复制延迟过高" description: " MySQL从库 {{ $labels .instance }} 的复制延迟超过30秒,当前值为 {{ $value | printf \\"%.2f\\" }}秒" # Nginx监控告警规则组 - name: nginx_alerts rules: # 1. Nginx服务不可用 - alert: NginxDown expr: nginx_up == 0 for: 1m labels: severity: critical category: availability annotations: summary: " Nginx服务不可用" description: " Nginx实例 {{ $labels .instance }} 已宕机超过1分钟" # 2. 请求错误率过高(超过5%) - alert: NginxHighErrorRate expr: (sum(rate(nginx_http_requests_total{status=~" 5.."}[5m])) by (instance) / sum(rate(nginx_http_requests_total[5m])) by (instance)) * 100 > 5 for: 2m labels: severity: warning category: errors annotations: summary: " Nginx请求错误率过高" description: " Nginx实例 {{ $labels .instance }} 的5xx错误率超过5%,当前值为 {{ $value | printf \\"%.2f\\" }}%" # 3. 活跃连接数过高(超过1000) - alert: NginxHighActiveConnections expr: nginx_connections_active > 1000 for: 2m labels: severity: warning category: performance annotations: summary: " Nginx活跃连接数过高" description: " Nginx实例 {{ $labels .instance }} 的活跃连接数超过1000,当前值为 {{ $value | printf \\"%.0f\\" }}" # 4. 请求处理时间过慢(95分位数超过1秒) - alert: NginxSlowRequests expr: histogram_quantile(0.95, rate(nginx_http_request_duration_seconds_bucket[5m])) > 1 for: 5m labels: severity: warning category: performance annotations: summary: " Nginx请求处理过慢" description: " Nginx实例 {{ $labels .instance }} 的95%请求处理时间超过1秒,当前值为 {{ $value | printf \\"%.3f\\" }}秒" # 5. 请求率异常(突然增长100%) - alert: NginxRequestRateAnomaly expr: (rate(nginx_http_requests_total[2m]) / rate(nginx_http_requests_total[2m] offset 5m)) > 2 for: 1m labels: severity: warning category: anomaly annotations: summary: " Nginx请求率异常" description: " Nginx实例 {{ $labels .instance }} 的请求率相比5分钟前增长了100%以上"
测试启动 1 2 3 4 5 6 7 8 9 10 11 12 13 14 15 16 17 18 19 20 21 22 /usr/local/prometheus-3.5.0.linux-amd64/prometheus --config.file=/usr/local/prometheus-3.5.0.linux-amd64/prometheus.yml cat > /etc/systemd/system/prometheus.service <<EOF [Unit] Description=Prometheus Server Documentation=https://prometheus.io/docs/introduction/overview/ After=network.target [Service] Restart=on-failure WorkingDirectory=/usr/local/prometheus-3.5.0.linux-amd64/ ExecStart=/usr/local/prometheus-3.5.0.linux-amd64/prometheus --config.file=/usr/local/prometheus-3.5.0.linux-amd64/prometheus.yml [Install] WantedBy=multi-user.target EOF systemctl daemon-reload systemctl start prometheus.service systemctl enable prometheus.service 访问本机 <http://10.163.2.100:9090>
部署exporter并连接到Prometheus 这些组件可以使用二进制部署,也可以使用容器部署
二进制部署node_exporter node_exporter由于需要主机权限,所以推荐使用二进制部署
二进制官网下载地址Download | Prometheus
1 2 3 4 5 6 7 8 9 10 11 12 13 14 15 16 17 18 19 20 21 22 23 24 wget https://github.com/prometheus/node_exporter/releases/download/v1.10.2/node_exporter-1.10.2.linux-amd64.tar.gz tar -xf node_exporter-1.10.2.linux-amd64.tar.gz cp -r node_exporter-1.10.2.linux-amd64 /usr/local/cat > /etc/systemd/system/node-exporter.service <<EOF [Unit] Description=Node Exporter After=network.target [Service] ExecStart=/usr/local/node_exporter-1.10.2.linux-amd64/node_exporter Restart=always User=root Group=root RestartSec=3 LimitNOFILE=4096 [Install] WantedBy=multi-user.target EOF systemctl daemon-reload systemctl enable node-exporter.service --now ss -tunlp | grep 9100 tcp LISTEN 0 4096 *:9100 *:* users :(("node_exporter",pid=650555 ,fd=3 ))
docker部署node_exporter(不推荐) 1 2 3 4 5 6 7 8 9 10 11 12 docker run -d \ --name=node_exporter \ --restart=always \ --pid="host" \ --net="host" \ -v "/:/host:ro" \ prom/node-exporter:latest \ --path.rootfs=/host netstat -tunlp | grep 9100 tcp 0 0 :::9100 :::* LISTEN 8984/node_exporter
docker部署mysql_exporter mysql运行在192.168.10.100:3306,root密码为mysql_Nw764j
二进制安装是同理,就不演示了
1 2 3 4 5 6 7 8 9 10 11 12 13 14 15 16 17 18 19 20 21 22 23 24 25 26 27 mysql -h 127.0.0.1 -P 3306 -u root -pmysql_Nw764j -e "CREATE USER IF NOT EXISTS 'exporter'@'%' IDENTIFIED BY 'mysql_Nw764j'; GRANT PROCESS, REPLICATION CLIENT, SELECT ON *.* TO 'exporter'@'%'; FLUSH PRIVILEGES;" cat > /etc/.my.cnf << 'EOF' [client] host=127.0.0.1 port=3306 user=exporter password=mysql_Nw764j [exporter] collect.global_status = true collect.global_variables = true collect.slave_status = true collect.info_schema.processlist = true collect.info_schema.innodb_metrics = true EOF docker run -d --name mysql-exporter \ --network host \ -v /etc/.my.cnf:/etc/.my.cnf:ro \ --restart unless-stopped \ prom/mysqld-exporter:main \ --config.my-cnf=/etc/.my.cnf \ --web.listen-address=:9101
docker部署nginx_exporter 我的nginx运行在192.168.10.100:80,这实际上是zabbix-server的nginx,我直接拿过来用了
使用nginx-exporter需要nginx自己安装了http_stub_status的模块,同时需要配置nginx.conf或者子配置文件,使访问x.x.x.x/nginx_status能够有数据
1 2 3 4 5 6 7 8 9 10 11 12 13 14 15 16 17 18 19 20 21 22 23 24 25 26 27 28 29 30 31 32 33 34 35 docker exec zabbix-docker-zabbix-web-nginx-mysql-1 nginx -V 2>&1 | grep -i stub_status && echo $? 0 docker exec zabbix-docker-zabbix-web-nginx-mysql-1 grep nginx-status /etc/nginx/http.d/nginx.conf -A6 location = /nginx-status { access_log off; allow 127.0.0.1; allow ::1; deny all; stub_status; } location = /nginx-status { access_log off; allow 127.0.0.1; allow 192.168.10.0/24; allow 172.17.0.0/24; deny all; stub_status; } nginx -s reload docker run -d \ --name nginx-exporter \ -p 9102:9102 \ --restart unless-stopped \ nginx/nginx-prometheus-exporter \ --web.listen-address=":9102" \ --nginx.scrape-uri="http://192.168.10.100/nginx-status"
Grafana部署(略) grafana也没配置文件的,他只是一个面板,设置什么的全在web上点点点就行,所以这种直接用docker也没问题,默认端口3000,默认账密admin/admin
1
2
3
4
5
6
7
8
docker run -d --name grafana \ -p 3000:3000 \ grafana/grafana:10.4.3 docker exec -it -uroot grafana /bin/bash grafana cli admin reset-admin-password admin123
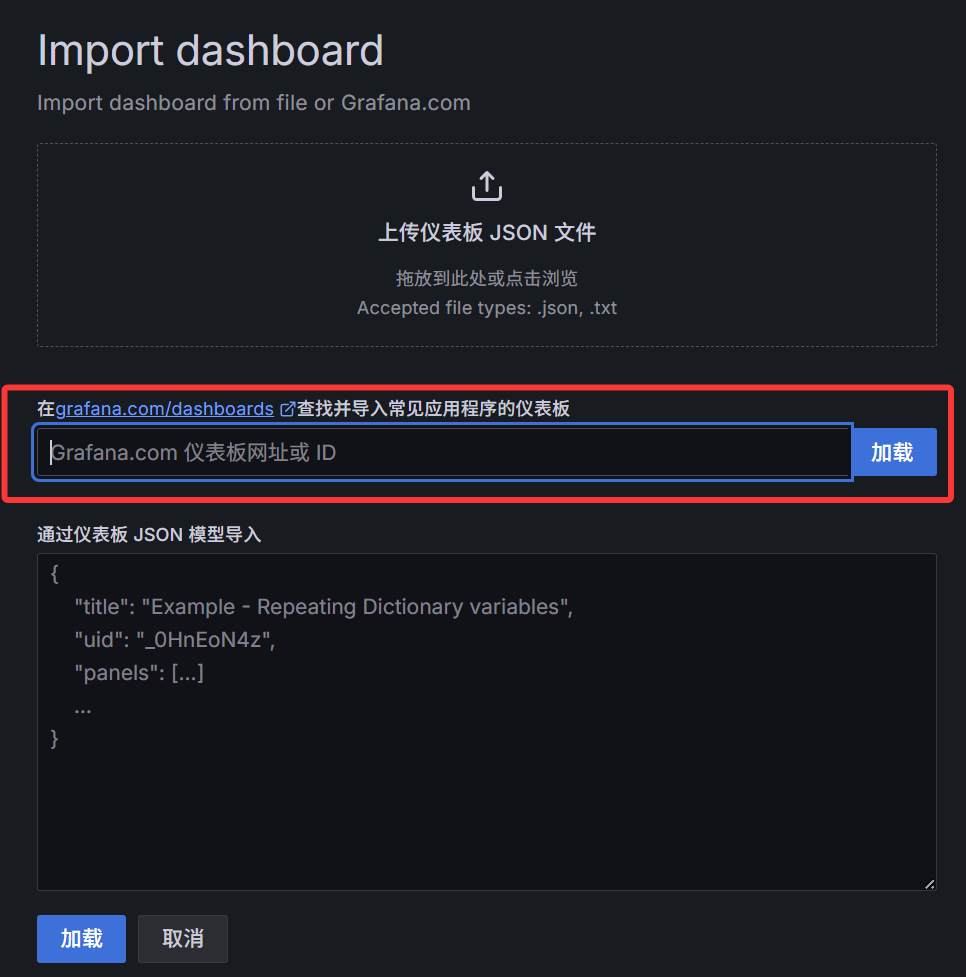
Grafana配置 官网:Grafana dashboards | Grafana Labs
比如:Node Exporter Dashboard 20240520 通用JOB分组版(序号16098)Node Exporter Dashboard 20240520 通用JOB分组版 | Grafana Labs
导入数据源
导入图表(json或序号)
使用序号可以直接导入
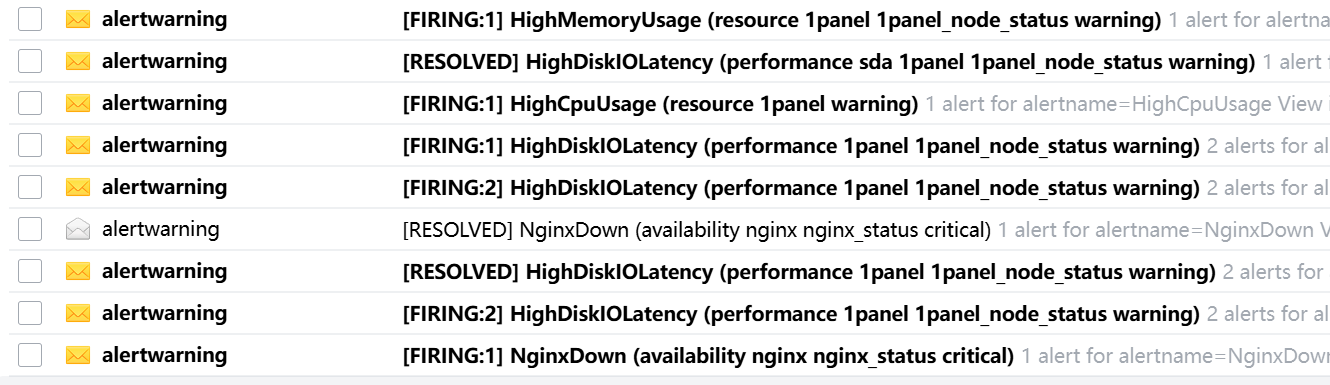
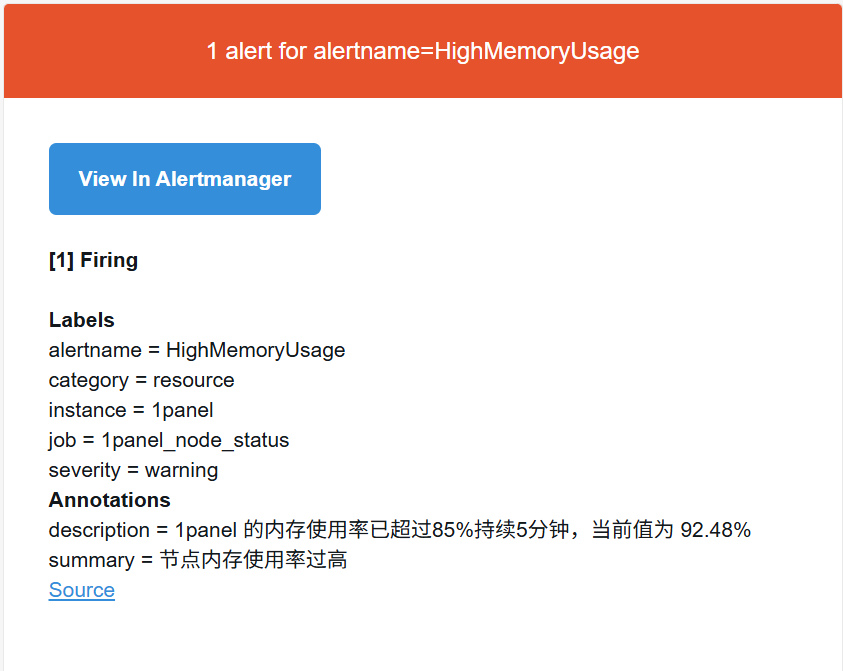
altermanage部署与告警推送设置 之前在配置文件里写的altermanager地址为192.168.10.100:9093
1
2
3
4
5
6
7
8
9
10
11
12
13
14
15
16
17
18
19
20
21
22
23
24
wget https://github.com/prometheus/alertmanager/releases/download/v0.30.0/alertmanager-0.30.0.linux-amd64.tar.gz tar -xf alertmanager-0.30.0.linux-amd64.tar.gz cp -r alertmanager-0.30.0.linux-amd64 /usr/local/global: resolve_timeout: 1m smtp_smarthost: 'smtp.163.com:25' smtp_from: 'alertwarning@163.com' smtp_auth_username: 'alertwarning@163.com' smtp_auth_password: 'xxxx' smtp_require_tls: false route: group_by: [alertname] group_wait: 10s group_interval: 10s repeat_interval: 10m receiver: default-receiver receivers: - name: 'default-receiver' email_configs: - to: '1320991378@qq.com' send_resolved: true
测试 1 2 3 stress --cpu 12 --vm 1 --vm-bytes 23G