环境准备
1
2
3
4
5
6
7
8
9
10
11
12
13
14
15
16
17
18
19
20
21
22
23
24
25
26
27
28
29
30
31
32
33
34
35
36
37
38
39
40
41
42
43
44
45
46
47
48
49
50
51
52
53
54
|
curl -Lo ./kind https://kind.sigs.k8s.io/dl/v0.31.0/kind-linux-amd64
chmod +x ./kind
sudo mv ./kind /usr/local/bin/kind
cat > kind-config.yaml <<EOF
kind: Cluster
apiVersion: kind.x-k8s.io/v1alpha4
networking:
apiServerAddress: "192.168.10.100" # 允许外部访问,kind默认只允许本机访问
apiServerPort: 6443 # 固定一个外部端口(可选)
nodes:
- role: control-plane
image: kindest/node:v1.31.0
extraMounts:
- hostPath: /var/run/docker.sock
containerPath: /var/run/docker.sock
- role: worker
image: kindest/node:v1.31.0
extraMounts:
- hostPath: /var/run/docker.sock
containerPath: /var/run/docker.sock
- role: worker
image: kindest/node:v1.31.0
extraMounts:
- hostPath: /var/run/docker.sock
containerPath: /var/run/docker.sock
EOF
kind create cluster --config kind-config.yaml --name ws-k8s
kubectl get nodes
NAME STATUS ROLES AGE VERSION
ws-k8s-control-plane Ready control-plane 18m v1.31.0
ws-k8s-worker Ready <none> 18m v1.31.0
ws-k8s-worker2 Ready <none> 18m v1.31.0
wget https://github.com/kubernetes-sigs/metrics-server/releases/latest/download/components.yaml
- --kubelet-insecure-tls
- --kubelet-insecure-tls=true
kubectl apply -f components.yaml
wget https://get.helm.sh/helm-v4.0.4-linux-amd64.tar.gz
tar -xf helm-v4.0.4-linux-amd64.tar.gz
cp linux-amd64/helm /usr/bin/
helm version
helm repo add prometheus-community https://prometheus-community.github.io/helm-charts
helm search repo kube-prometheus-stack
NAME CHART VERSION APP VERSION DESCRIPTION
prometheus-community/kube-prometheus-stack 80.13.2 v0.87.1 kube-prometheus-stack collects Kubernetes manif...
|
Helm部署
helm部署默认安装主要组件(依赖values.yaml中的变量),包括Prometheus、altermanager、grafana。
同时还会部署监控组件node_exporter,kube-state-metrics等组件,并且默认带了对于k8s系统组件比如dns、etcd、apiserver等的监控
1
2
3
4
5
6
7
8
9
10
11
12
13
14
15
16
17
18
19
20
21
22
23
24
25
26
27
28
29
30
31
32
33
34
35
36
37
38
39
40
41
42
43
44
45
46
47
48
49
50
51
52
53
54
55
56
57
58
|
helm pull prometheus-community/kube-prometheus-stack --version 80.13.2
tar -xf kube-prometheus-stack-80.13.2.tgz
cd kube-prometheus-stack/
helm install prometheus ./ -f values.yaml
NAME: prometheus
LAST DEPLOYED: Fri Jan 9 17:19:43 2026
NAMESPACE: default
STATUS: deployed
REVISION: 1
DESCRIPTION: Install complete
NOTES:
kube-prometheus-stack has been installed. Check its status by running:
kubectl --namespace default get pods -l "release=prometheus"
Get Grafana 'admin' user password by running:
kubectl --namespace default get secrets prometheus-grafana -o jsonpath="{.data.admin-password}" | base64 -d ; echo
Access Grafana local instance:
export POD_NAME=$(kubectl --namespace default get pod -l "app.kubernetes.io/name=grafana,app.kubernetes.io/instance=prometheus" -oname)
kubectl --namespace default port-forward $POD_NAME 3000
Get your grafana admin user password by running:
kubectl get secret --namespace default -l app.kubernetes.io/component=admin-secret -o jsonpath="{.items[0].data.admin-password}" | base64 --decode ; echo
kubectl get pods
NAME READY STATUS RESTARTS AGE
alertmanager-prometheus-kube-prometheus-alertmanager-0 2/2 Running 0 5m47s
prometheus-grafana-fd588f886-zjlpf 3/3 Running 0 6m17s
prometheus-kube-prometheus-operator-65685b655d-8sbvv 1/1 Running 0 6m17s
prometheus-kube-state-metrics-698d844f6b-xbx5v 1/1 Running 0 6m17s
prometheus-prometheus-kube-prometheus-prometheus-0 2/2 Running 0 5m47s
prometheus-prometheus-node-exporter-pgzkx 1/1 Running 0 6m17s
prometheus-prometheus-node-exporter-rq2pt 1/1 Running 0 6m17s
prometheus-prometheus-node-exporter-wzwfm 1/1 Running 0 6m17s
kubectl get svc
NAME TYPE CLUSTER-IP EXTERNAL-IP PORT(S) AGE
alertmanager-operated ClusterIP None <none> 9093/TCP,9094/TCP,9094/UDP 5m53s
prometheus-grafana ClusterIP 10.96.61.96 <none> 80/TCP 6m23s
prometheus-kube-prometheus-alertmanager ClusterIP 10.96.212.51 <none> 9093/TCP,8080/TCP 6m23s
prometheus-kube-prometheus-operator ClusterIP 10.96.19.63 <none> 443/TCP 6m23s
prometheus-kube-prometheus-prometheus ClusterIP 10.96.120.45 <none> 9090/TCP,8080/TCP 6m23s
prometheus-kube-state-metrics ClusterIP 10.96.89.145 <none> 8080/TCP 6m23s
prometheus-operated ClusterIP None <none> 9090/TCP 5m53s
prometheus-prometheus-node-exporter ClusterIP 10.96.161.171 <none> 9100/TCP 6m23s
kubectl port-forward --address=0.0.0.0 svc/prometheus-kube-prometheus-prometheus 9090:9090 &
kubectl port-forward --address=0.0.0.0 svc/prometheus-grafana 3000:80 &
kubectl port-forward --address=0.0.0.0 svc/prometheus-kube-prometheus-alertmanager 9093:9093 &
|
变量文件参数说明
1
2
3
4
5
6
7
8
9
10
11
12
13
14
15
16
17
18
19
20
21
22
23
24
25
26
27
28
29
30
31
32
33
34
35
36
|
...
prometheus:
...
prometheusSpec:
...
scrapeInterval: ""
evaluationInterval: 30s
retention: 10d
retentionSize: ""
storageSpec:{}
additionalScrapeConfigs: []
serviceMonitorSelectorNilUsesHelmValues: True
serviceMonitorSelector: {}
ruleSelectorNilUsesHelmValues:
...
altermanager:
enabled: true
...
config:
global:
resolve_timeout: 5m
inhibit_rules:
...
route:
group_by: ['namespace']
group_wait: 30s
group_interval: 5m
repeat_interval: 12h
...
grafana:
enabled: true
...
defaultRules:
create: false
|
Prometheus监控k8s
helm安装时,会安装名为monitoring.coreos.com/v1的CRD,这是官方推荐的方式,可以通过crd直接创建kind为ServiceMonitor和PodMonitor的监控规则
Prometheus提供3种方法进行监控:
- ServiceMonitor(监控Service自动发现)
- PodMonitor(监控pod自动发现)
- additionalScrapeConfigs(传统方式手动添加)
自定义监控nginx
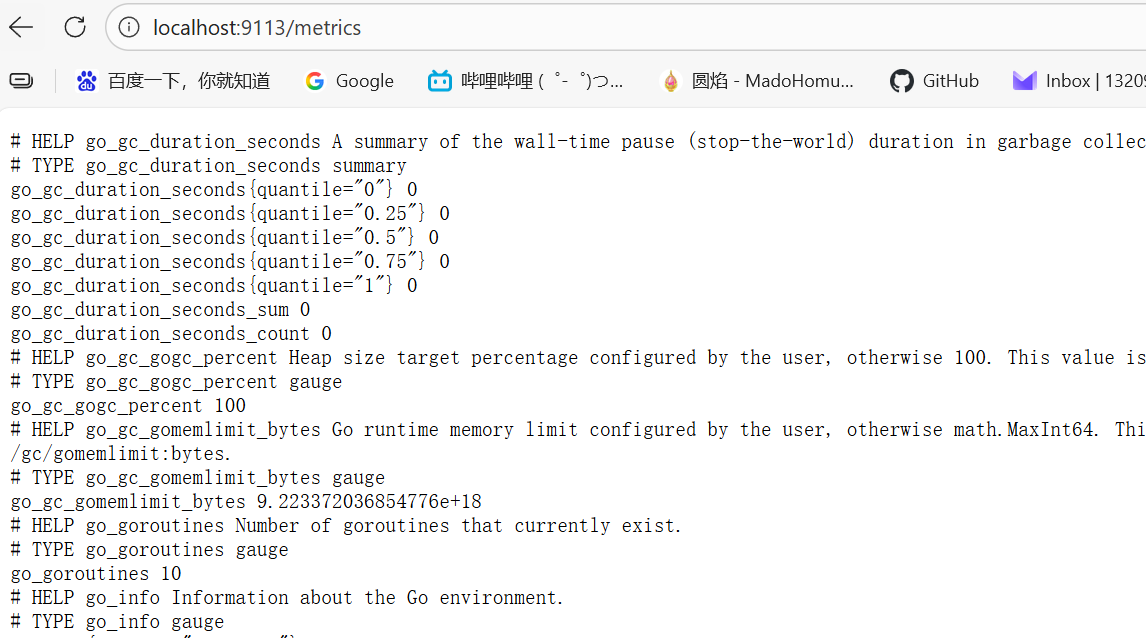
默认Nginx不暴露Prometheus格式的指标(如nginx_connections_active)
| 方案 |
优点 |
缺点 |
| stub_status + Exporter |
轻量级,官方支持 |
需要额外Sidecar容器 |
| OpenTelemetry插件 |
单容器方案,支持更多指标 |
需要重新编译Nginx(复杂) |
| 黑盒监控 |
无需修改Nginx配置 |
只能监控基础HTTP状态(非内部指标) |
部署nginx
1
2
3
4
5
6
7
8
9
10
11
12
13
14
15
16
17
18
19
20
21
22
23
24
25
26
27
28
29
30
31
32
33
34
35
36
37
38
39
40
41
42
43
44
45
46
47
48
49
50
51
52
53
54
55
56
57
58
59
60
61
62
63
64
65
66
67
68
69
70
71
72
73
74
75
|
---
apiVersion: apps/v1
kind: Deployment
metadata:
name: nginx
spec:
replicas: 1
selector:
matchLabels:
app: nginx
template:
metadata:
labels:
app: nginx
spec:
containers:
- name: nginx
image: nginx:latest
ports:
- containerPort: 80
- containerPort: 8080
volumeMounts:
- name: nginx-config
mountPath: /etc/nginx/conf.d/nginx_status.conf
subPath: nginx_status.conf
volumes:
- name: nginx-config
configMap:
name: nginx-config
---
apiVersion: v1
kind: Service
metadata:
name: nginx-service
spec:
selector:
app: nginx
ports:
- name: http
protocol: TCP
port: 80
targetPort: 80
- name: http-status
protocol: TCP
port: 8080
targetPort: 8080
kubectl apply -f nginx-deployment.yaml
apiVersion: v1
kind: ConfigMap
metadata:
name: nginx-config
data:
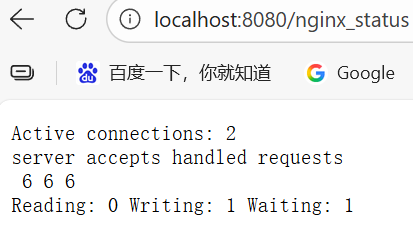
nginx_status.conf: |
server {
listen 8080;
server_name localhost;
location /nginx_status {
stub_status on;
access_log off;
allow all;
deny all;
}
}
kubectl apply -f nginx-configmap.yaml
kubectl port-forward services/nginx-service 8080:8080
|
部署nginx_exporter
Exporter的方式可以使用单独部署或者sidecar部署的方式,我这里使用单独部署方式
1
2
3
4
5
6
7
8
9
10
11
12
13
14
15
16
17
18
19
20
21
22
23
24
25
26
27
28
29
30
31
32
33
34
35
36
37
38
39
40
41
42
|
apiVersion: apps/v1
kind: Deployment
metadata:
name: nginx-exporter
spec:
replicas: 1
selector:
matchLabels:
app: nginx-exporter
template:
metadata:
labels:
app: nginx-exporter
spec:
containers:
- name: exporter
image: nginx/nginx-prometheus-exporter:latest
ports:
- containerPort: 9113
args:
- -nginx.scrape-uri=http://nginx-service.default.svc.cluster.local:8080/nginx_status
---
apiVersion: v1
kind: Service
metadata:
name: nginx-exporter-service
labels:
app: nginx-exporter
spec:
selector:
app: nginx-exporter
ports:
port: 9113
targetPort: 9113
kubectl apply -f nginx-exporter-deployment.yaml
kubectl port-forward services/nginx-exporter-service 9113:9113
|
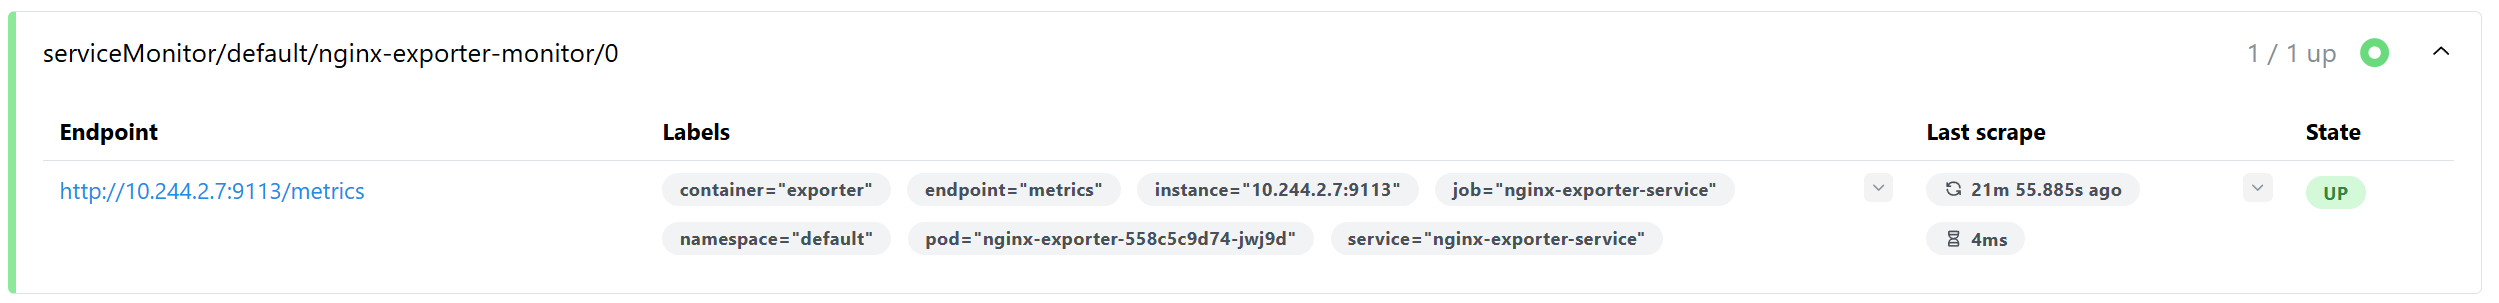
创建ServiceMonitor
1
2
3
4
5
6
7
8
9
10
11
12
13
14
15
16
17
18
19
20
21
22
23
24
25
26
27
28
29
|
---
apiVersion: monitoring.coreos.com/v1
kind: ServiceMonitor
metadata:
name: nginx-exporter-monitor
labels:
release: prometheus
spec:
selector:
matchLabels:
app: nginx-exporter
namespaceSelector:
any: true
endpoints:
- port: metrics
interval: 30s
path: /metrics
kubectl apply -f nginx-servicemonitor.yaml
prometheus:
prometheusSpec:
serviceMonitorSelector:
matchLabels:
release: prometheus
helm upgrade prometheus ./ -f values.yaml
|
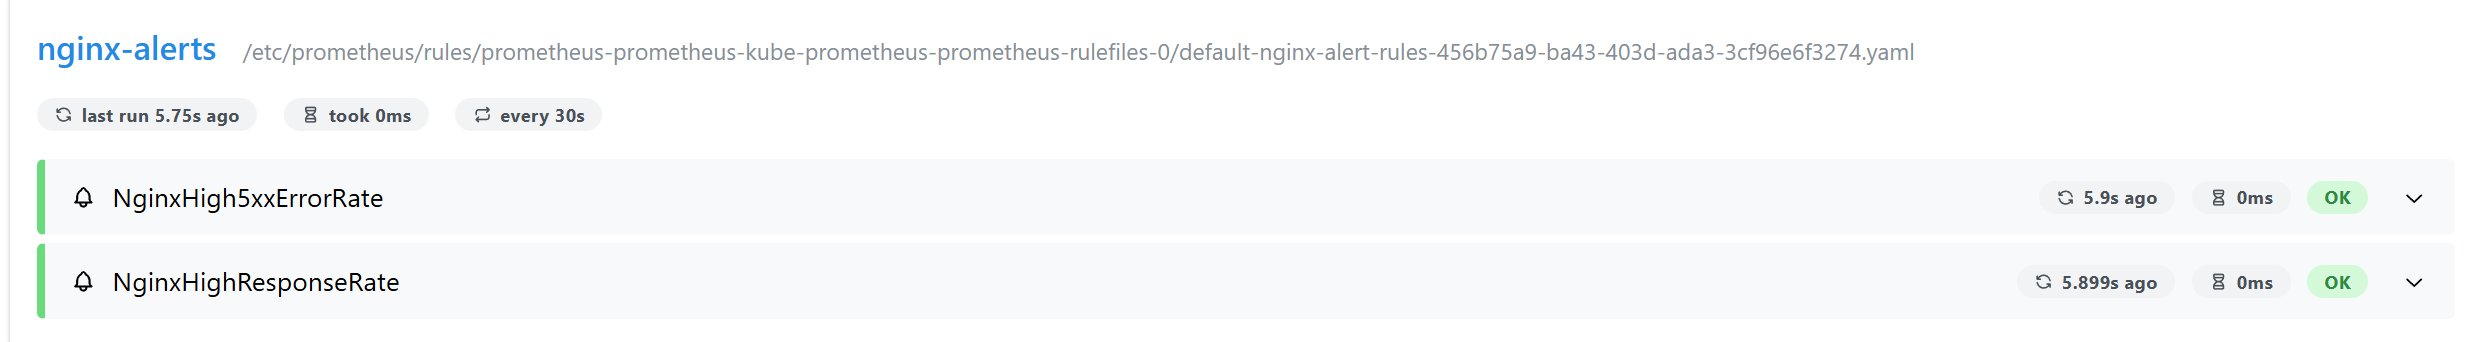
自定义nginx告警规则
1
2
3
4
5
6
7
8
9
10
11
12
13
14
15
16
17
18
19
20
21
22
23
24
25
26
27
28
29
30
31
32
33
34
35
36
37
38
39
40
41
42
43
44
45
46
|
---
apiVersion: monitoring.coreos.com/v1
kind: PrometheusRule
metadata:
name: nginx-alert-rules
labels:
release: prometheus
spec:
groups:
rules:
- alert: NginxHigh5xxErrorRate
expr: |
sum(rate(nginx_http_requests_total{status=~"5.."}[1m])) by (host)
/
sum(rate(nginx_http_requests_total[1m])) by (host)
> 0.05
for: 2m
labels:
severity: critical
annotations:
summary: "Nginx {{ $labels.host }} 5xx 错误率过高"
description: "5xx 错误率 {{ $value }} > 5%,持续 2 分钟"
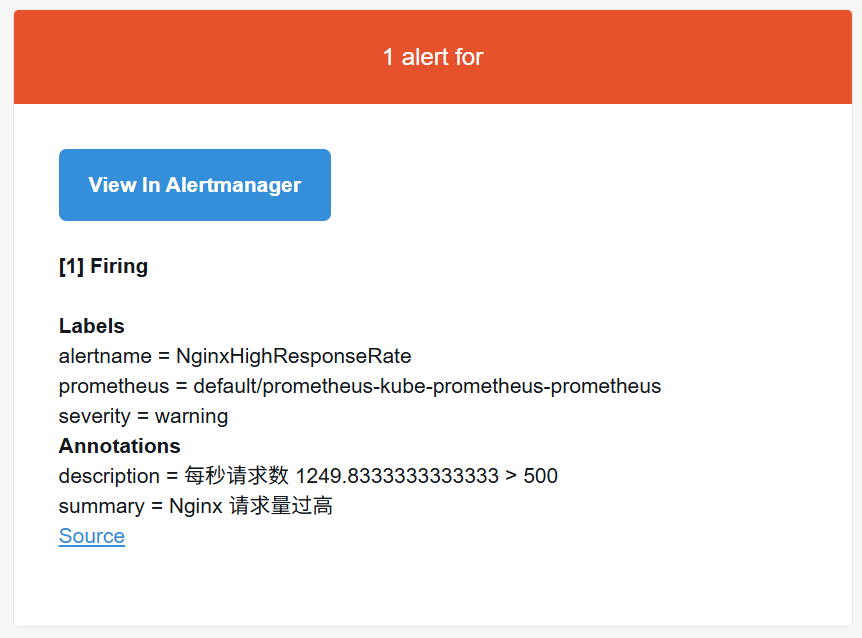
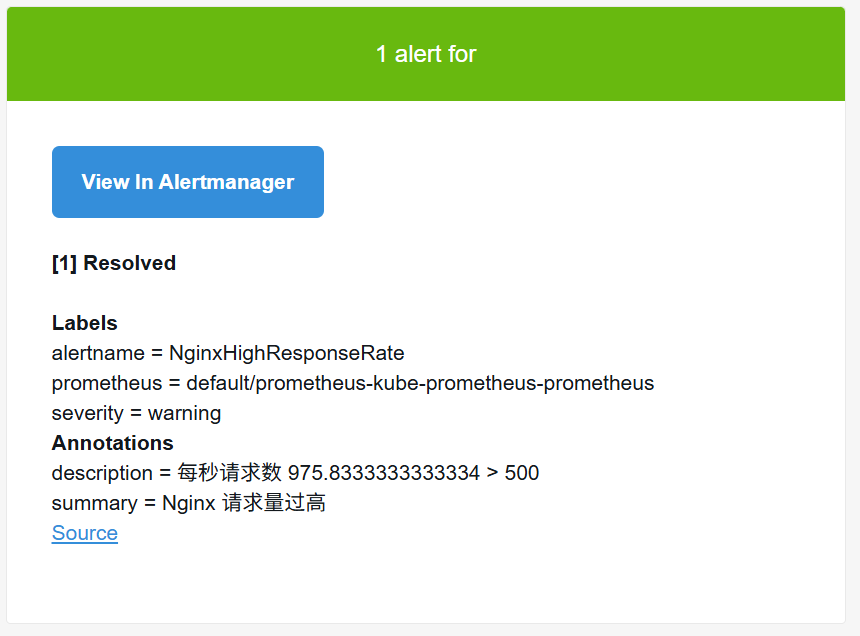
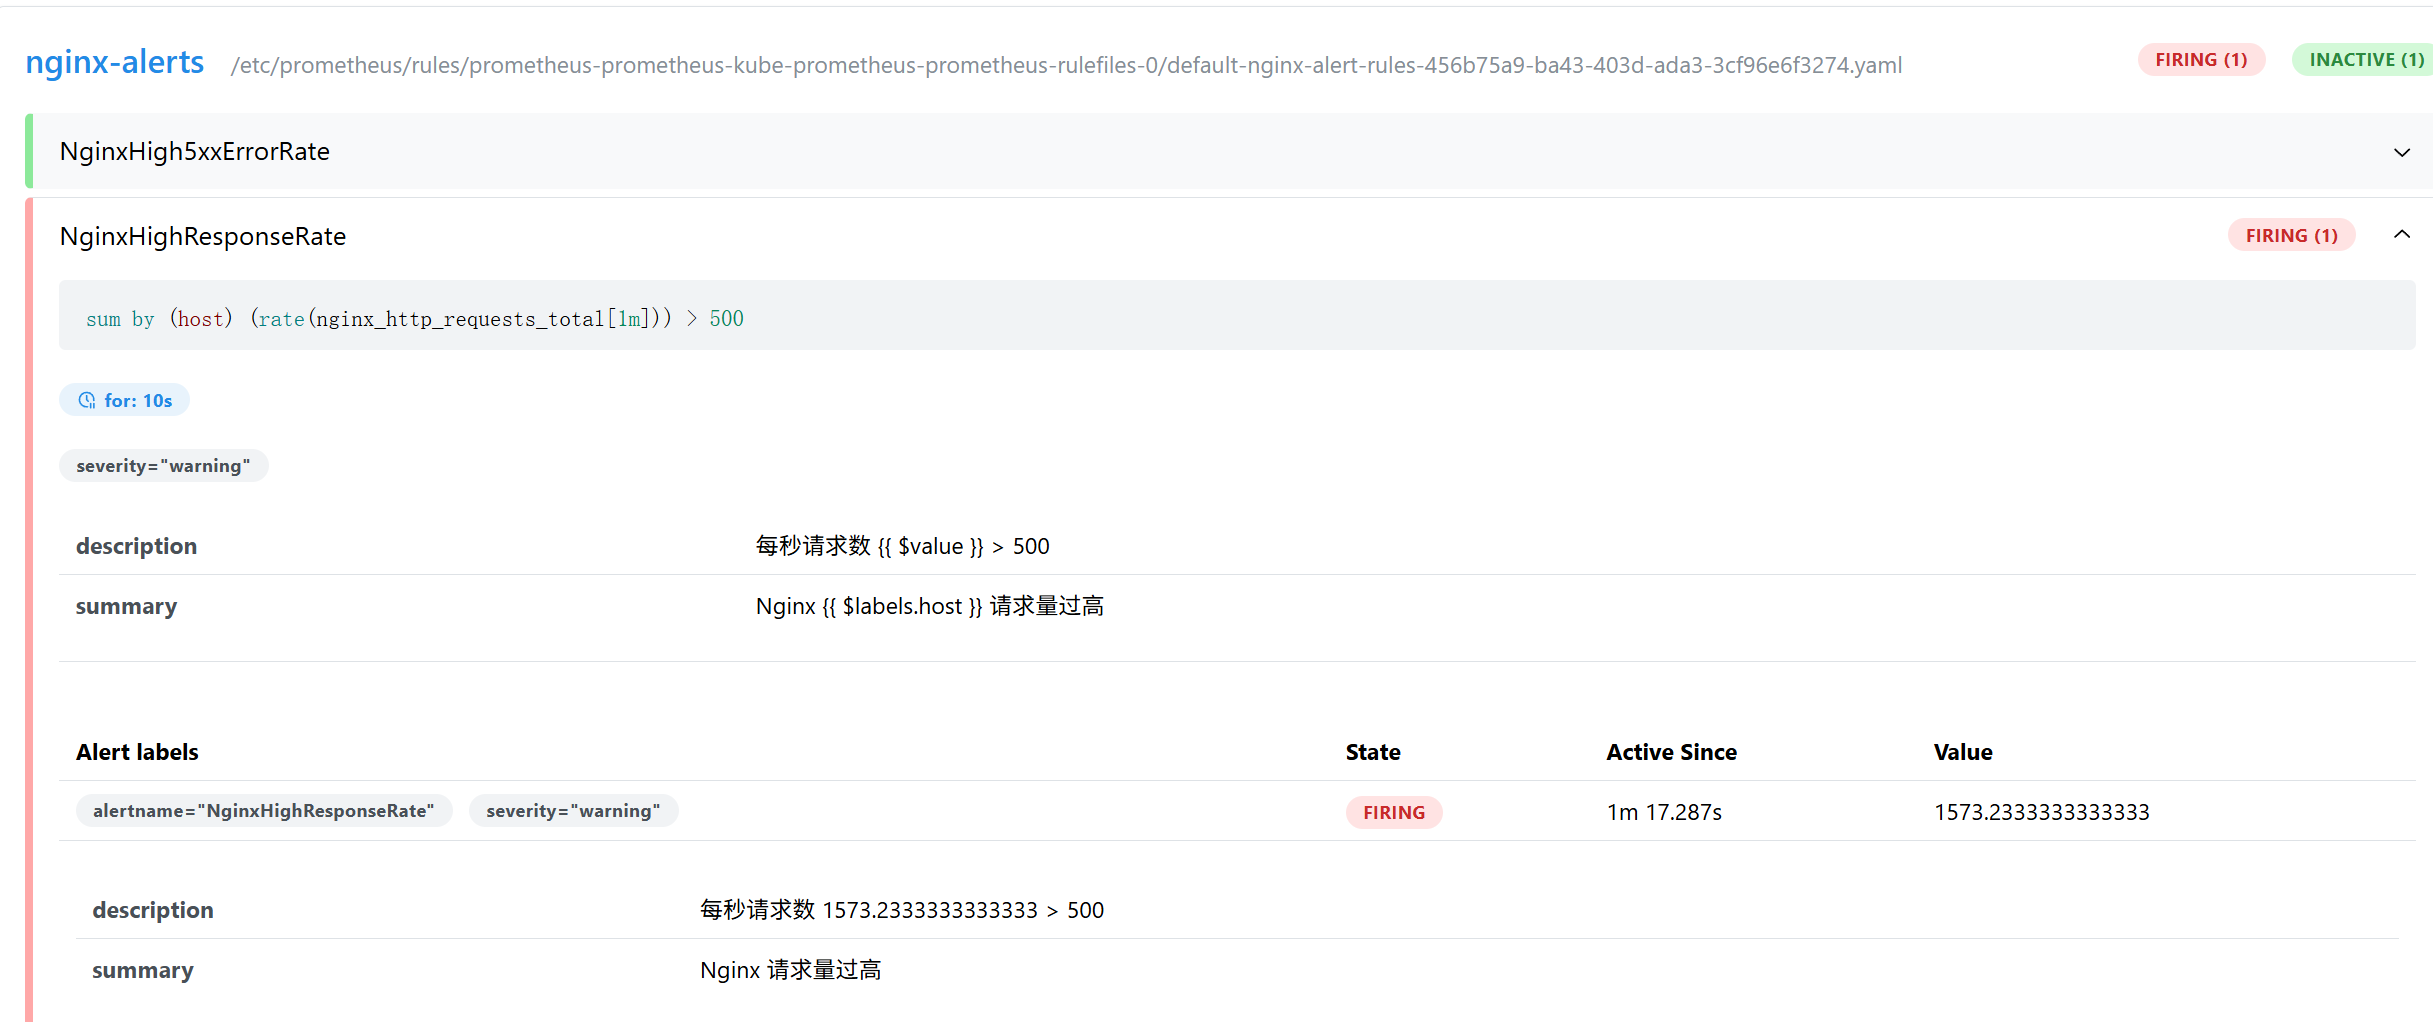
- alert: NginxHighResponseRate
expr: |
sum(rate(nginx_http_requests_total[1m])) by (host) > 500
for: 10s
labels:
severity: warning
annotations:
summary: "Nginx {{ $labels.host }} 请求量过高"
description: "每秒请求数 {{ $value }} > 500"
kubectl apply -f nginx-alert-rules.yaml
prometheus:
prometheusSpec:
ruleSelector:
matchLabels:
release: prometheus
helm upgrade prometheus ./ -f values.yaml
|
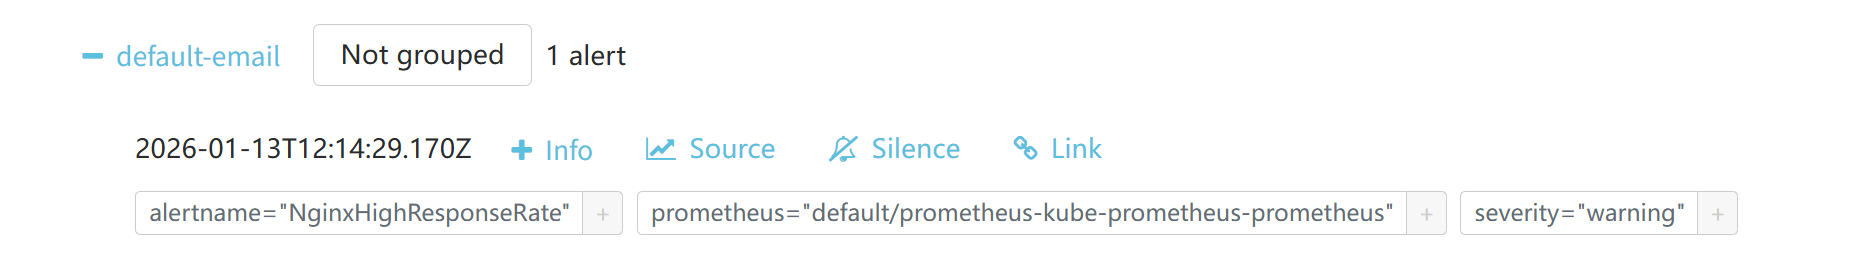
模拟测试告警
1
2
3
4
5
6
7
8
9
10
11
12
13
14
15
16
17
18
19
20
21
22
23
24
25
26
27
28
| kubectl port-forward services/nginx-service 8081:80 &
yum install httpd-tools -y
ab -n 1000 -c 10 localhost:8081/error
cat > /etc/nginx/conf.d/default.conf <<EOF
server {
listen 80;
listen [::]:80;
server_name localhost;
location /error {
return 502;
}
location / {
root /usr/share/nginx/html;
index index.html index.htm;
}
error_page 500 502 503 504 /50x.html;
location = /50x.html {
root /usr/share/nginx/html;
}
}
EOF
yum install siege -y
siege -c 255 -r 100 http://localhost:8081
|
配置altermanager
1
2
3
4
5
6
7
8
9
10
11
12
13
14
15
16
17
18
19
20
21
22
23
24
25
26
27
28
29
30
31
32
33
34
35
36
37
|
alertmanager:
config:
config:
global:
resolve_timeout: 5m
smtp_smarthost: 'smtp.163.com:25'
smtp_from: 'alertwarning@163.com'
smtp_auth_username: 'alertwarning@163.com'
smtp_auth_password: 'GAANBCIHILSARBYD'
smtp_require_tls: false
...
route:
receiver: 'default-email'
group_by: ['namespace']
group_wait: 30s
group_interval: 5m
repeat_interval: 12h
routes:
- receiver: 'null'
matchers:
- alertname = "Watchdog"
continue: false
receivers:
- name: 'null'
- name: 'default-email'
email_configs:
- to: '1320991378@qq.com'
send_resolved: true
headers:
Subject: '[{{ .Status }}] {{ .Labels.alertname }}'
html: '{{ template "email.default.html" . }}'
templates:
- '/etc/alertmanager/config/*.tmpl'
helm upgrade prometheus ./ -f values.yaml
|
模拟测试发送邮件
1
| siege -c 255 -r 10000 http://localhost:8081
|